AI Monitoring & Observability: Theo Dõi Mô Hình AI Trong Production
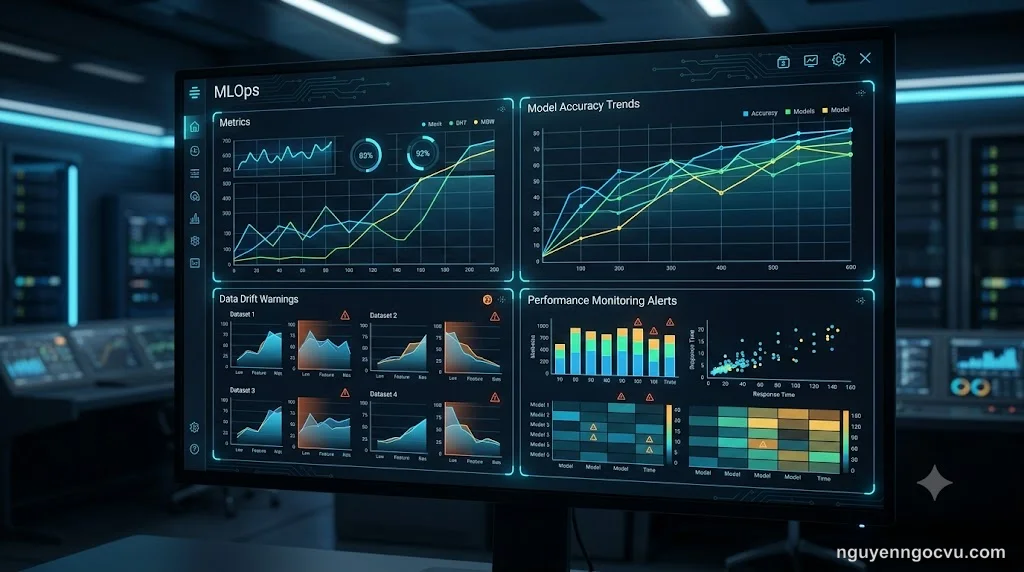
Monitoring AI model trong production là việc theo dõi liên tục accuracy, data quality và performance để phát hiện sớm khi model bắt đầu cho kết quả sai. Khác với monitoring ứng dụng thông thường (uptime, latency, errors), AI monitoring tập trung vào model-specific metrics: drift detection, prediction distribution shifts, feature changes và retraining triggers. Thiếu monitoring đúng cách, model có thể âm thầm “hỏng” trong nhiều tuần - vẫn chạy, vẫn trả về predictions, nhưng accuracy đã giảm từ 92% xuống 67% mà không ai biết.
Tại Sao AI Model Cần Monitoring Riêng?
Vấn Đề Đặc Thù: Silent Failures
Application software thường fail nhanh và rõ ràng - crash, 500 error, timeout. AI models fail âm thầm:
Ví dụ thực tế: Hệ thống dự đoán churn khách hàng của một SaaS company được train trên data 2024. Sang Q2/2025, công ty thay đổi pricing model và thêm tính năng mới. Model vẫn chạy bình thường, API trả về predictions với confidence 0.85+, nhưng:
- False negatives tăng 40% - bỏ lỡ nhiều khách hàng thực sự sắp rời đi
- Precision giảm từ 82% xuống 61% - retention team lãng phí effort vào khách hàng không có risk
- Business impact: Mất $180K ARR trong 2 tháng trước khi marketing team phát hiện “prediction model hình như sai”
Root cause: Concept drift - quan hệ giữa features (usage patterns, support tickets) và target (churn) thay đổi do pricing mới, nhưng không ai monitor accuracy theo thời gian.
Application Monitoring vs AI Monitoring
| Aspect | Traditional App | AI Model |
|---|---|---|
| Failure mode | Crash, timeout, 500 error | Silent accuracy degradation |
| Health signal | Uptime, error rate | Accuracy, drift metrics |
| Root cause | Code bug, infra issue | Data shift, concept change |
| Fix | Deploy hotfix | Retrain model, feature engineering |
| Detection time | Seconds (alerts fire) | Weeks/months (if no monitoring) |
Các Loại Drift Cần Monitor
1. Data Drift (Input Distribution Shift)
Định nghĩa: Phân phối của input features thay đổi so với training data.
Ví dụ:
- Model dự đoán giá nhà train trên data 2020-2023 (lãi suất 3-5%). Năm 2024 lãi suất lên 8% → feature
interest_ratenằm ngoài training range → predictions không đáng tin. - Computer vision model nhận diện sản phẩm lỗi train trong nhà máy sáng tự nhiên. Đêm bật đèn LED → lighting distribution shift → recall giảm 25%.
Detection methods:
- Statistical tests: Kolmogorov-Smirnov test, Chi-square test so sánh distribution hiện tại vs baseline (training data)
- Distance metrics: Population Stability Index (PSI), Kullback-Leibler divergence, Wasserstein distance
- Threshold: PSI > 0.2 = significant shift; PSI > 0.1 = moderate shift
Code example (Evidently library):
from evidently.metric_preset import DataDriftPreset
from evidently.report import Report

report = Report(metrics=[DataDriftPreset()])
report.run(
    reference_data=train_df,  # baseline
    current_data=production_df  # recent production data
)
report.show()  # HTML dashboard

# Programmatic access
drift_detected = report.as_dict()['metrics'][0]['result']['dataset_drift']
if drift_detected:
    alert_team("Data drift detected - review model")
2. Concept Drift (Target Relationship Shift)
Định nghĩa: Quan hệ giữa features và target thay đổi - features vẫn trong range cũ nhưng ý nghĩa khác.
Ví dụ:
- Model dự đoán click-through rate train trước COVID. Sau COVID, user behavior thay đổi (ở nhà nhiều hơn, shopping habits khác) → cùng features (age, device, time) nhưng click pattern khác → accuracy giảm.
- Fraud detection model train năm 2023. Năm 2024 scammers chuyển sang tactic mới (social engineering thay vì phishing) → old features ít predictive power hơn.
Detection (khó hơn data drift):
- Ground truth comparison: So accuracy hiện tại vs baseline (cần actual labels - khó có realtime)
- Proxy metrics: Monitor business KPIs (conversion rate, complaint rate) - indirect signal
- A/B testing: Champion model vs baseline, detect nếu champion underperform
3. Prediction Drift (Output Distribution Shift)
Định nghĩa: Phân phối của predictions thay đổi bất thường.
Ví dụ:
- Classification model dự đoán spam. Tháng 1: 5% spam, 95% ham. Tháng 3: đột ngột 40% spam. Hoặc model bắt đầu predict cùng 1 class cho mọi input.
- Regression model dự đoán demand. Predictions tập trung quanh mean value, mất variance → model “regress to average” (overfitting symptom or feature issue).
Detection:
# Monitor prediction class distribution
current_predictions = model.predict(recent_data)
class_distribution = pd.Series(current_predictions).value_counts(normalize=True)

# Compare to baseline (e.g., training set predictions)
baseline_distribution = {...}  # from training
shift = calculate_psi(baseline_distribution, class_distribution)

if shift > 0.15:
    log.warning(f"Prediction distribution shift: PSI={shift:.3f}")
4. Label Drift (True Target Distribution Shift)
Định nghĩa: Phân phối của actual outcomes thay đổi (có hoặc không có concept drift).
Ví dụ:
- Loan default prediction. Economic recession → default rate tăng từ 2% lên 8% → class imbalance khác hẳn training data.
- Product recommendation. Black Friday → conversion rate tăng 3x → metrics như precision/recall không comparable với baseline.
Handling: Retrain với recent data để model học distribution mới, hoặc adjust decision threshold.
Metrics Cần Monitor
Performance Metrics (Bắt Buộc)
Track theo thời gian (daily/weekly):
Classification:
- Accuracy, Precision, Recall, F1-score - compute khi có ground truth labels (có thể delay 1-7 ngày)
- AUC-ROC - stability của probability predictions
- Confusion matrix - pattern của errors (false positives vs false negatives shift?)
Regression:
- MAE, RMSE, R² - track degradation
- Residual distribution - systematic errors? (residuals should be random)
Ranking/Recommendation:
- NDCG, MRR - quality of ranked results
- Coverage - % items được recommend
- Diversity - avoid filter bubble
Realtime proxy (khi chưa có ground truth):
- Prediction confidence distribution - model bắt đầu uncertain hơn?
- Prediction variance - consistency của predictions cho similar inputs
Operational Metrics
- Latency: P50, P95, P99 inference time (SLA: <100ms cho realtime, <1s cho batch)
- Throughput: predictions/second, requests/second
- Resource usage: CPU, GPU, memory per request (cost optimization)
- Error rate: % requests fail (API timeout, OOM, invalid input)
Data Quality Metrics
Monitor input data:
- Missing values rate per feature
- Out-of-range values (feature > max seen in training)
- Cardinality changes (categorical feature có value mới)
- Schema validation (data type, required fields)
# Example: Feature value range monitoring
for feature in critical_features:
    current_min, current_max = production_data[feature].min(), production_data[feature].max()
    train_min, train_max = train_stats[feature]['min'], train_stats[feature]['max']

    if current_min < train_min * 0.8 or current_max > train_max * 1.2:
        alert(f"Feature {feature} out of range: [{current_min}, {current_max}] vs training [{train_min}, {train_max}]")
Kiến Trúc Monitoring System
Components
┌─────────────┐
│ Model API   │ ─┬─> Predictions
└─────────────┘  │
                 ├─> Logging (input, output, metadata)
                 │   └─> Data Lake / Warehouse
                 │       │
                 │       ├─> Batch Jobs (daily/weekly)
                 │       │   ├─ Compute metrics (accuracy, drift)
                 │       │   ├─ Generate reports
                 │       │   └─ Trigger alerts
                 │       │
                 │       └─> Streaming Pipeline (realtime)
                 │           └─> Monitor latency, throughput, errors
                 │
                 └─> Monitoring Dashboard
                     ├─ Grafana / Kibana (metrics visualization)
                     ├─ Evidently / WhyLabs (drift reports)
                     └─ PagerDuty / Slack (alerts)
Stack Examples
Lightweight (startup, <10 models):
- Logging: Write predictions to CSV/Parquet on S3
- Metrics computation: Python script chạy daily (cron job)
- Visualization: Streamlit dashboard hoặc Jupyter notebook
- Alerts: Email khi metrics < threshold
- Cost: ~$50/month (S3 storage + EC2 small instance)
Mid-size (10-100 models):
- Logging: Postgres hoặc ClickHouse
- Metrics: Apache Airflow orchestration, Evidently library
- Visualization: Grafana + Prometheus
- Alerts: Slack webhook, PagerDuty
- Cost: ~$500-2K/month (infrastructure + engineer time)
Enterprise (100+ models):
- Platform: Datadog AI Monitoring, Arize AI, Fiddler AI
- Logging: Kafka stream → data warehouse
- Metrics: Automated drift detection, anomaly detection
- Alerts: Intelligent alerting (reduce noise), root cause analysis
- Cost: $5K-50K/month (vendor pricing)
Alert Strategy: Tránh Alert Fatigue
Thiết Lập Thresholds Thông Minh
Anti-pattern: Alert mọi metric deviation nhỏ → team ignore alerts (alert fatigue).
Best practice: Prioritize dựa trên business impact.
Tiered alerting:
P0 (Critical - page on-call):
- Accuracy drop >15% trong 24h
- API error rate >5%
- Latency P95 >2x SLA
P1 (High - Slack notification):
- Accuracy drop 10-15%
- Data drift PSI >0.25
- Throughput drop >30%
P2 (Medium - weekly report):
- Accuracy drop 5-10%
- Moderate drift (PSI 0.15-0.25)
- Feature importance shift
P3 (Low - dashboard only):
- Minor drift (PSI <0.15)
- Latency within SLA but trend increasing
Contextual Alerts
So sánh với recent baseline, không phải training baseline (giảm false positives).
# Example: Rolling window comparison
recent_7d_accuracy = compute_accuracy(last_7_days_data)
baseline_accuracy = compute_accuracy(days_8_to_28_data)  # previous 3 weeks

drop = baseline_accuracy - recent_7d_accuracy

if drop > 0.10:  # 10% absolute drop
    severity = "P0"
elif drop > 0.05:
    severity = "P1"
else:
    return  # No alert

send_alert(
    severity=severity,
    message=f"Accuracy drop: {baseline_accuracy:.2%} → {recent_7d_accuracy:.2%}",
    context={
        "baseline_period": "weeks 2-4",
        "current_period": "last 7 days",
        "drift_metrics": drift_report_link
    }
)
Retraining Workflow Automation
Trigger Conditions
Automatic retrain khi:
- Performance drop: Accuracy < threshold
- Drift detected: PSI >0.2 sustained >3 days
- Scheduled: Monthly/quarterly (calendar-based)
- Data volume: Accumulated >X new labeled samples
Human-in-the-loop retrain khi:
- Concept drift suspected (cần feature engineering)
- Major data schema change
- Business logic change
CI/CD for ML
# Example: GitHub Actions workflow for retraining
name: Model Retraining

on:
  schedule:
    - cron: '0 2 * * 0'  # Weekly Sunday 2AM
  workflow_dispatch:  # Manual trigger
  repository_dispatch:  # Alert-triggered
    types: [drift_detected]

jobs:
  retrain:
    runs-on: ubuntu-latest
    steps:
      - name: Fetch latest data
        run: python scripts/fetch_training_data.py --days 90

      - name: Train model
        run: python train.py --config prod_config.yaml

      - name: Evaluate on holdout
        run: |
          python evaluate.py --model new_model.pkl --data holdout.csv
          # Fail if accuracy < current production model - 2%

      - name: A/B test (shadow mode)
        run: |
          # Deploy new model alongside current, serve 5% traffic
          python deploy.py --model new_model.pkl --traffic 0.05 --mode shadow

      - name: Monitor shadow deployment
        run: |
          # Wait 24h, compare metrics
          sleep 86400
          python compare_models.py --champion current --challenger new_model

      - name: Promote if better
        run: |
          if challenger_accuracy > champion_accuracy + 0.01:
            python deploy.py --model new_model.pkl --traffic 1.0 --mode replace
          else:
            echo "Challenger not significantly better - keep champion"
Versioning & Rollback
Mỗi model deployment cần track:
- Model artifact:
model_v23.pkl(weights, config) - Training data snapshot:
train_data_2026-08-20.parquet - Code version: Git commit hash
- Hyperparameters:
config_v23.yaml - Metrics:
metrics_v23.json(accuracy, drift, etc.)
Rollback nhanh khi model mới worse:
# Single command rollback to last known good version
./deploy.sh --model-version v22 --reason "v23 accuracy drop 8%"
Store models trong model registry (MLflow, Weights & Biases, AWS SageMaker Model Registry) với metadata tags: production, candidate, archived.
Tools & Platforms
Open-Source
Evidently (Python library):
- Drift detection, data quality, model performance reports
- Generate interactive HTML dashboards
- Free, active development
- Use case: Add to existing pipeline, full control
WhyLabs (freemium SaaS):
- Lightweight logging SDK, cloud-based analysis
- Free tier: 10M rows/month
- Use case: Quick setup, don’t want to manage infra
Prometheus + Grafana:
- General-purpose monitoring (latency, throughput)
- Custom metrics via Python client
- Flexible alerting rules
- Use case: Already use for app monitoring, extend to ML
MLflow:
- Experiment tracking, model registry, deployment
- Built-in metrics logging
- Use case: End-to-end MLOps platform
Commercial
Arize AI:
- Enterprise ML observability platform
- Automated drift detection, root cause analysis
- Integration với major cloud providers
- Price: ~$1K/month starting
Datadog AI Monitoring:
- Extension của Datadog APM cho ML
- Unified dashboards (app + model metrics)
- Price: Add-on to Datadog subscription
Fiddler AI:
- Explainability + monitoring
- Model performance tracking, fairness audits
- Use case: Regulated industries (finance, healthcare)
Case Study: E-Commerce Recommendation System
Context: Mid-size e-commerce (50K products, 500K users/month). Recommendation model drives 30% revenue.
Challenge: Model accuracy degraded từ 22% CTR (click-through rate) xuống 14% trong Q4 2025 mà team không biết cho đến khi CEO hỏi “sao revenue giảm?”.
Solution implemented:
-
Logging layer: Ghi mọi recommendation request (user_id, items_shown, items_clicked, timestamp) vào ClickHouse.
-
Daily metrics computation:
# Airflow DAG chạy mỗi sáng yesterday_ctr = clicks / impressions # from yesterday's logs baseline_ctr = 0.22 # target if yesterday_ctr < baseline_ctr * 0.9: # drop >10% send_slack_alert(f"CTR dropped to {yesterday_ctr:.1%}") -
Weekly drift detection:
# So sánh user feature distribution (last 7 days vs last 30 days) features = ['age_bucket', 'device_type', 'session_count', 'avg_order_value'] drift_report = evidently.Report(DataDriftPreset()) drift_report.run(reference=last_30d, current=last_7d) if drift_report.dataset_drift: retrain_candidate = True -
A/B testing framework: Mỗi model mới chỉ serve 10% traffic trong 3 ngày. Promote nếu CTR improvement >2% (statistically significant).
-
Automated retraining: Trigger khi (CTR drop >5%) OR (PSI >0.2) OR (monthly schedule).
Results (sau 6 tháng):
- Detection time: Từ 6-8 tuần → 1-2 ngày (alerts fire khi CTR dip)
- Downtime reduction: 4 lần drift caught và fixed trước khi impact revenue
- Retraining cadence: 2-4 tuần (data-driven) thay vì 6 tháng (manual)
- Business impact: CTR stable 21-23%, revenue attribution từ recs tăng từ 30% lên 38%
Lessons learned:
- Đừng chờ CEO phát hiện model sai - automate monitoring
- Ground truth labels (clicks) có delay 1 ngày nhưng vẫn đủ nhanh để course-correct
- Prediction drift (distribution of recommended items) là leading indicator tốt hơn accuracy (lagging indicator)
Pitfalls & Best Practices
❌ Pitfalls
1. Monitor quá nhiều metrics, quên business goal
- Anti-pattern: Dashboard 50 metrics, không ai biết cái nào quan trọng
- Fix: Chọn 3-5 North Star metrics gắn với business KPI (revenue, retention, satisfaction)
2. Alert threshold cứng nhắc (static thresholds)
- Anti-pattern: “Alert nếu accuracy <85%” - không tính seasonality, data shifts tự nhiên
- Fix: Dynamic thresholds dựa trên rolling baseline, statistical bounds (e.g., 2 std dev từ mean)
3. Không có ground truth strategy
- Anti-pattern: Deploy model, không thu thập actual labels → không thể tính accuracy
- Fix: Thiết kế feedback loop (user ratings, manual review sampling, A/B test outcomes)
4. Retrain quá thường xuyên hoặc quá ít
- Quá thường (mỗi ngày): Model không stable, khó debug, waste compute
- Quá ít (mỗi năm): Model stale, miss opportunities
- Fix: Data-driven triggers + scheduled backup (e.g., monthly minimum)
5. Monitoring != Debugging
- Monitoring chỉ nói “có vấn đề”. Cần tools để tại sao - feature analysis, error clustering, explainability
- Fix: Kết hợp monitoring với SHAP values, feature importance tracking, error analysis dashboards
✅ Best Practices
1. Start simple, scale gradually
- Week 1: Log predictions + ground truth vào database
- Week 2: Daily script tính accuracy, gửi email report
- Month 1: Grafana dashboard với 5 core metrics
- Month 2: Thêm drift detection
- Month 3: Alert automation + retraining pipeline
2. Align metrics với business outcomes
- E-commerce: CTR, conversion rate, revenue per user
- Fraud detection: False positive rate (user friction) vs false negative rate (fraud loss)
- Healthcare: Sensitivity (catch disease) > Specificity (reduce false alarms)
3. Version everything
- Model, data, code, config → reproducibility khi cần debug “model v15 tháng 3 sao lại tốt hơn v16?”
4. Test monitoring infrastructure
- Inject synthetic drift, observe alerts fire đúng
- Simulate model failure, verify rollback works
5. Document runbooks
- “Nếu alert X fire, check Y, nếu Z thì retrain, nếu W thì rollback” → team mới onboard nhanh
Kết Luận
AI monitoring không phải nice-to-have - đó là bảo hiểm cho AI investment. Model đưa lên production mà không monitor giống lái xe bịt mắt: may mắn thì đến đích, nhưng nhiều khả năng đâm vào tường trước khi nhận ra lạc hướng.
Điểm then chốt:
- Bắt đầu từ ngày đầu - đừng đợi model fail mới setup monitoring
- Automate detection, not just logging - alerts phải fire trước khi CEO hỏi
- Tie metrics to business KPIs - model accuracy 95% vô nghĩa nếu revenue giảm
- Make retraining routine - treat models như living systems, not static artifacts
Chi phí setup monitoring (~$100-500/tháng cho mid-size team) thấp hơn RẤT NHIỀU so với cost of silent failures (lost revenue, user trust, opportunity cost). Trong thời đại AI-first products, monitoring chính xác model chính là monitoring chính xác business.
Đọc thêm:
- AI Testing: Đánh Giá Chất Lượng Mô Hình AI Trước Khi Deploy - Các phương pháp test model trước khi lên production, bổ sung cho monitoring sau khi deploy.
- AI Safety: Rủi Ro Và Biện Pháp An Toàn Khi Triển Khai AI - Góc nhìn rộng hơn về risk management cho AI systems, trong đó monitoring là một layer phòng thủ.
- Agentic AI Workflows: Orchestration Hệ Thống AI Agents - Monitoring multi-agent systems có độ phức tạp cao hơn, cần thêm trace correlation và agent-level metrics.
Câu hỏi thường gặp
Model drift là gì và tại sao nguy hiểm?
Model drift là hiện tượng mô hình AI mất độ chính xác theo thời gian do data thay đổi. Nguy hiểm vì model vẫn chạy bình thường nhưng cho kết quả sai - có thể mất hàng tuần mới phát hiện nếu không monitor.
Monitoring AI model khác gì monitoring app thông thường?
Monitoring app theo dõi uptime/latency/errors. Monitoring AI model thêm accuracy degradation, prediction distribution shifts, feature drift và data quality - những metric đặc thù quyết định model có còn đáng tin không.
Cần monitor những metric nào cho AI model?
Bắt buộc: accuracy/precision/recall theo thời gian, prediction distribution, input data stats. Khuyến nghị: latency, throughput, resource usage, feature importance changes, anomaly detection rate.
Khi nào cần retrain model?
Khi phát hiện performance drop >5-10% (tùy business impact), data drift vượt threshold, hoặc concept drift (relationship giữa features và target thay đổi). Nên có alert automation thay vì check manual.
Chi phí setup monitoring cho AI model có cao không?
Open-source tools như Evidently, WhyLabs (free tier), Prometheus + Grafana (free) đủ cho hầu hết startup. Enterprise tools như Datadog AI, Arize AI có phí nhưng setup nhanh hơn. ROI rất cao - sớm phát hiện drift tiết kiệm hàng trăm triệu từ quyết định sai.